• Alors « sortir de l’écologie punitive », je suppose que nos peigne-culs du gouvernement s’autorisent à dire des conneries pareilles parce que là le réchauffement climatique, c’est pas la période la plus désagréable (à Montpellier, fin janvier il faisait des températures que j’ai connues fin août au club Mickey des Pingouins dans le Pas-de-Calais). On serait en quelque sorte dans le « dérèglement climatique pas trop punitif » pour l’instant.

    Par contre je suis un peu anxieux pour cet été : mathématiquement on va se retrouver plongés en plein dans le premier chapitre du Ministère du futur.

    Mais, hein, qui aurait peu prévoir… ?

  • What is happening in the Atlantic Ocean to the AMOC?
    Stefan Rahmstorf (Potsdam Institute for Climate Impact Research)
    https://www.realclimate.org/index.php/archives/2023/07/what-is-happening-in-the-atlantic-ocean-to-the-amoc

    For various reasons I’m motivated to provide an update on my current thinking regarding the slowdown and tipping point of the Atlantic Meridional Overturning Circulation (AMOC). I attended a two-day AMOC session at the IUGG Conference the week before last, there’s been interesting new papers, and in the light of that I have been changing my views somewhat. Here’s ten points, starting from the very basics, so you can easily jump to the aspects that interest you.


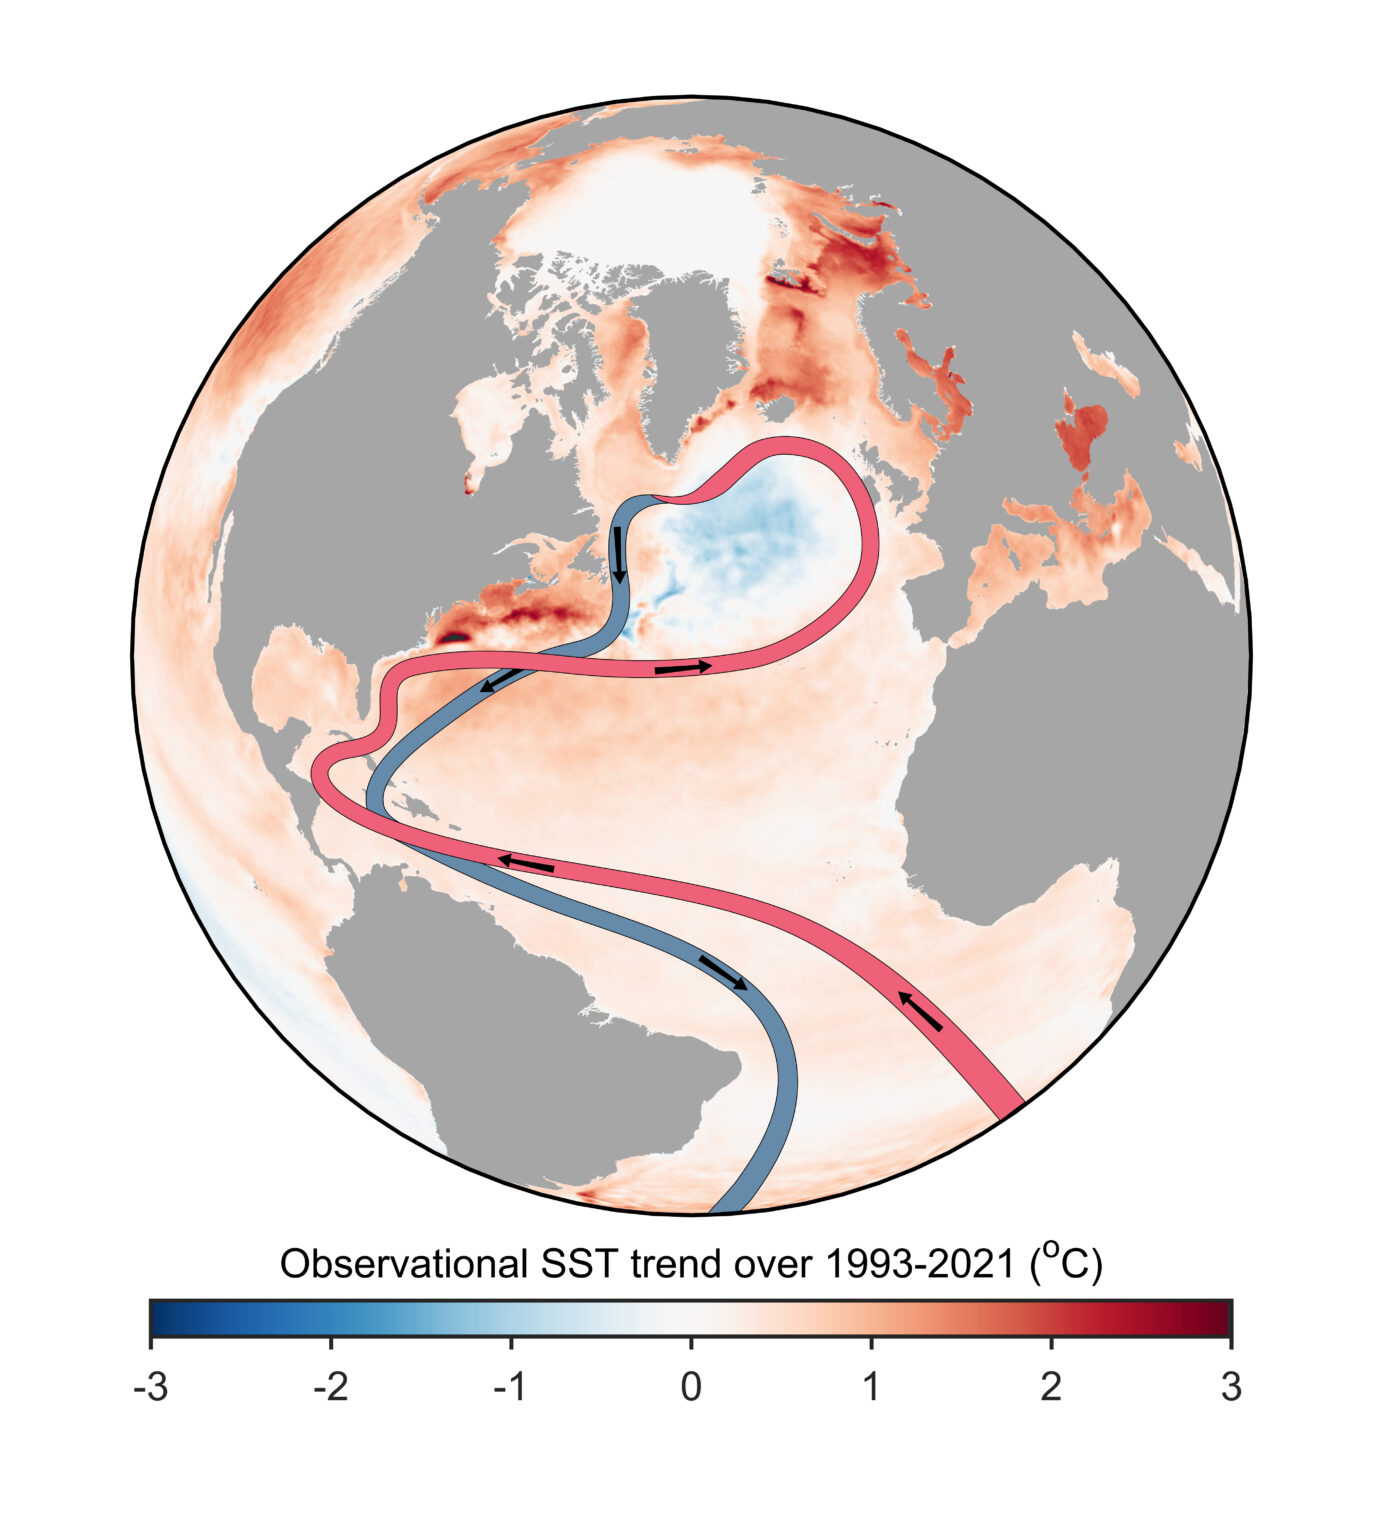
    Figure 1. A very rough schematic of the AMOC: warm northward flow near the surface, deep-water formation, deep southward return flow in 2000 – 3000 meters depth. In the background the observed sea surface temperature (SST) trend since 1993 from the Copernicus satellite service, showing the ‘cold blob’ in the northern Atlantic west of the British Isles discussed below. Graph by Ruijian Gou.

    1. The AMOC is a big deal for climate. The Atlantic meridional overturning circulation (AMOC) is a large-scale overturning motion of the entire Atlantic, from the Southern Ocean to the high north. It moves around 15 million cubic meters of water per second (i.e. 15 Sverdrup). The AMOC water passes through the Gulf Stream along a part of its much longer journey, but contributes only the smaller part of its total flow of around 90 Sverdrup. The AMOC is driven by density differences and is a deep reaching vertical overturning of the Atlantic; the Gulf Stream is a near-surface current near the US Atlantic coast and mostly driven by winds. The AMOC however moves the bulk of the heat into the northern Atlantic so is highly relevant for climate, because the southward return flow is very cold and deep (heat transport is the flow multiplied by the temperature difference between northward and southward flow). The wind-driven part of the Gulf Stream contributes much less to the net northward heat transport, because that water returns to the south at the surface in the eastern Atlantic at a temperature not much colder than the northward flow, so it leaves little heat behind in the north. So for climate impact, the AMOC is the big deal, not the Gulf Stream.

    2. The AMOC has repeatedly shown major instabilities in recent Earth history, for example during the Last Ice Age, prompting concerns about its stability under future global warming, see e.g. Broecker 1987 who warned about “unpleasant surprises in the greenhouse”. Major abrupt past climate changes are linked to AMOC instabilities, including Dansgaard-Oeschger-Events and Heinrich Events. For more on this see my Review Paper in Nature.

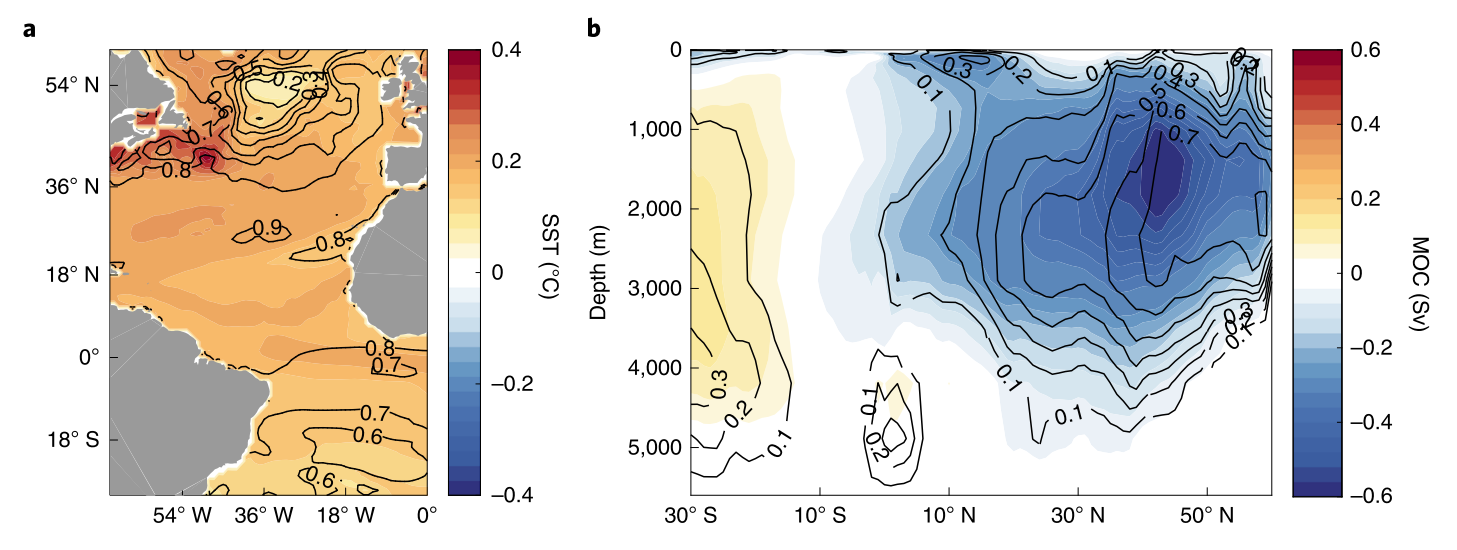
    3. The AMOC has weakened over the past hundred years. We don’t have direct measurements over such a long time (only since 2004 from the RAPID project), but various indirect indications. We have used the time evolution of the ‘cold blob’ shown above, using SST observations since 1870, to reconstruct the AMOC in Caesar et al. 2018. In that article we also discuss a ‘fingerprint’ of an AMOC slowdown which also includes excessive warming along the North American coast, also seen in Figure 1. That this fingerprint is correlated with the AMOC in historic runs with CMIP6 models has recently been shown by Latif et al. 2022, see Figure 2.


    Figure 2. Correlation of SST variations (left) with AMOC variations (right) in historic runs with CMIP6 models, from Latif et al. 2022.

    Others have used changes in the Florida Current since 1909, or changes in South Atlantic salinity, to reconstruct past AMOC changes – for details check out my last AMOC article here at RealClimate.

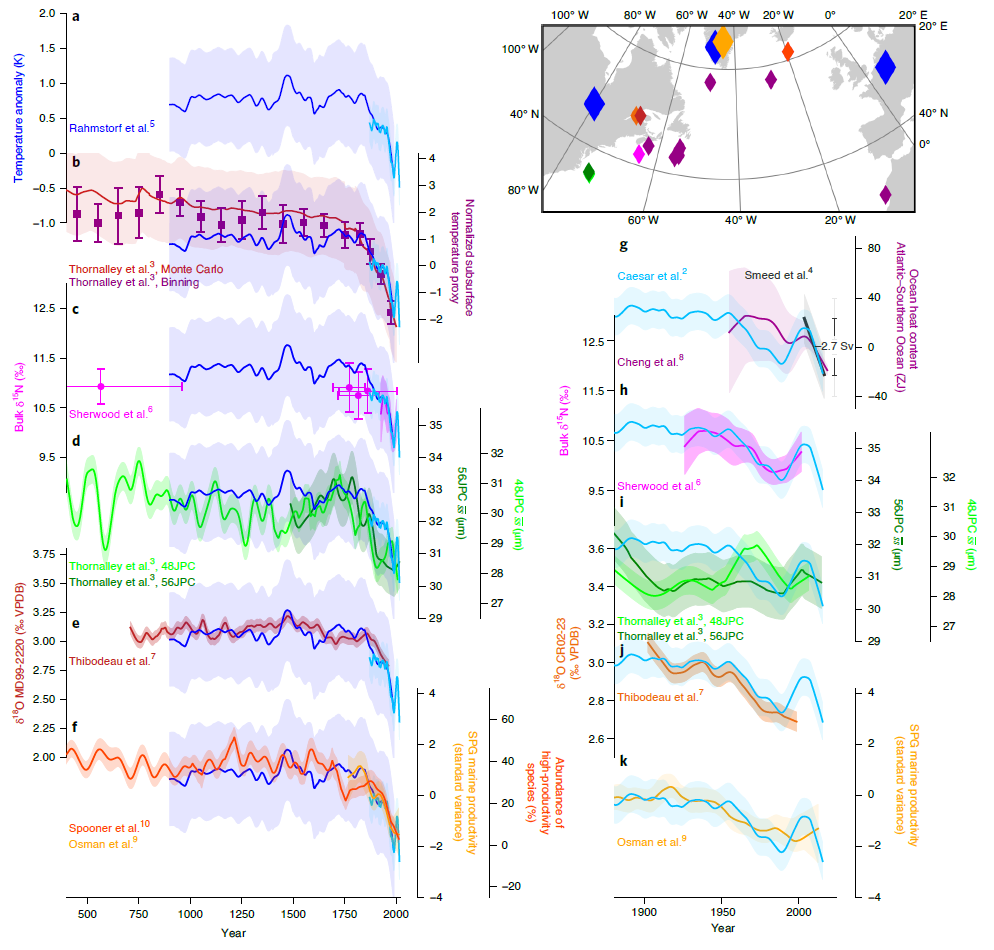
    4. The AMOC is now weaker than any time in the past millennium. Several groups of paleoclimatologists have used a variety of methods to reconstruct the AMOC over longer time spans. We compiled the AMOC reconstructions we could find in Caesar et al. 2021, see Figure 3. In case you’re wondering how the proxy data reconstructions compare with other methods for the recent variability since 1950, that is shown in Caesar et al. 2022 (my take: quite well).


    Figure 3. A compilation of 9 different proxy series for the AMOC evolution. Data locations are shown in the inset map, from Caesar et al. 2021.

    5. The long-term weakening trend is anthropogenic. For one, it is basically what climate models predict as a response to global warming, though I’d argue they underestimate it (see point 8 below). A recent study by Qasmi 2023 has combined observations and models to isolate the role of different drivers and concludes for the ‘cold blob’ region: “Consistent with the observations, an anthropogenic cooling is diagnosed by the method over the last decades (1951–2021) compared to the preindustrial period.”

    In addition there appear to be decadal oscillations particularly after the mid-20th Century. They may be natural variability, or an oscillatory response to modern warming, given there is a delayed negative feedback in the system (weak AMOC makes the ‘cold blob’ region cool down, that increases the water density there, which strengthens the AMOC). Increasing oscillation amplitude may also be an early warning sign of the AMOC losing stability, see point 10 below.

    The very short term SST variability (seasonal, interannual) in the cold blob region is likely just dominated by the weather, i.e. surface heating and cooling, and not indicative of changes in ocean currents.

    6. The AMOC has a tipping point, but it is highly uncertain where it is. This tipping point was first described by Stommel 1961 in a highly simple model which captures a fundamental feedback. The region in the northern Atlantic where the AMOC waters sink down is rather salty, because the AMOC brings salty water from the subtropics to this region. If it becomes less salty by an inflow of freshwater (rain or meltwater from melting ice), the water becomes less dense (less “heavy”), sinks down less, the AMOC slows down. Thus it brings less salt to the region, which slows the AMOC further. It is called the salt advection feedback. Beyond a critical threshold this becomes a self-amplifying “vicious circle” and the AMOC grinds to a halt. That threshold is the AMOC tipping point. Stommel wrote: “The system is inherently frought with possibilities for speculation about climatic change.”

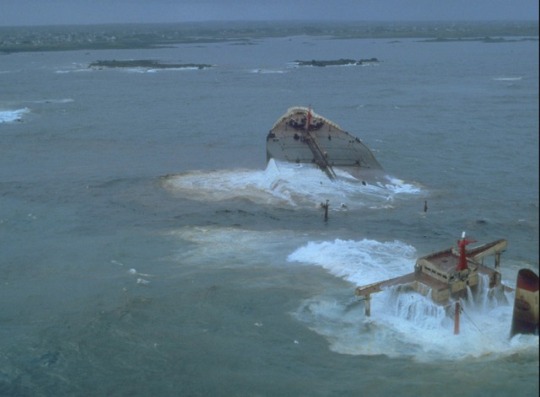
    That this tipping point exists has been confirmed in numerous models since Stommel’s 1961 paper, including sophisticated 3-dimensional ocean circulation models as well as fully fledged coupled climate models. We published an early model comparison about this in 2005. The big uncertainty, however, is in how far the present climate is from this tipping point. Models greatly differ in this regard, the location appears to be sensitively dependent on the finer details of the density distribution of the Atlantic waters. I have compared the situation to sailing with a ship into uncharted waters, where you know there are dangerous rocks hidden below the surface that could seriously damage your ship, but you don’t know where they are.

    7. Standard climate models have suggested the risk is relatively small during this century. Take the IPCC reports: For example, the Special Report on the Ocean and Cryosphere concluded:
    The AMOC is projected to weaken in the 21st century under all RCPs (very likely), although a collapse is very unlikely (medium confidence). Based on CMIP5 projections, by 2300, an AMOC collapse is about as likely as not for high emissions scenarios and very unlikely for lower ones (medium confidence).

    It has long been my opinion that “very unlikely”, meaning less than 10% in the calibrated IPCC uncertainty jargon, is not at all reassuring for a risk we really should rule out with 99.9 % probability, given the devastating consequences should a collapse occur.

    8. But: Standard climate models probably underestimate the risk. There are two reasons for that. They largely ignore Greenland ice loss and the resulting freshwater input to the northern Atlantic which contributes to weakening the AMOC. And their AMOC is likely too stable. There is a diagnostic for AMOC stability, namely the overturning freshwater transport, which I introduced in a paper in 1996 based on Stommel’s 1961 model. Basically, if the AMOC exports freshwater out of the Atlantic, then an AMOC weakening would lead to a fresher (less salty) Atlantic, which would weaken the AMOC further. Data suggest that the real AMOC exports freshwater, in most models it imports freshwater. This is still the case and was also discussed at the IUGG conference.

    Here a quote from Liu et al. 2014, which nicely sums up the problem and gives some references:
    Using oceanic freshwater transport associated with the overturning circulation as an indicator of the AMOC bistability (Rahmstorf 1996), analyses of present-day observations also indicate a bistable AMOC (Weijer et al. 1999; Huisman et al. 2010; Hawkins et al. 2011a,b; Bryden et al. 2011; Garzoli et al. 2012). These observational studies suggest a potentially bistable AMOC in the real world. In contrast, sensitivity experiments in CGCMs tend to show a monostable AMOC (Stouffer et al. 2006), indicating a model bias toward a monostable AMOC. This monostable bias of the AMOC in CGCMs, as first pointed out by Weber et al. (2007) and later confirmed by Drijfhout et al. (2011), could be related to a bias in the northward freshwater transport in the South Atlantic by the meridional overturning circulation.

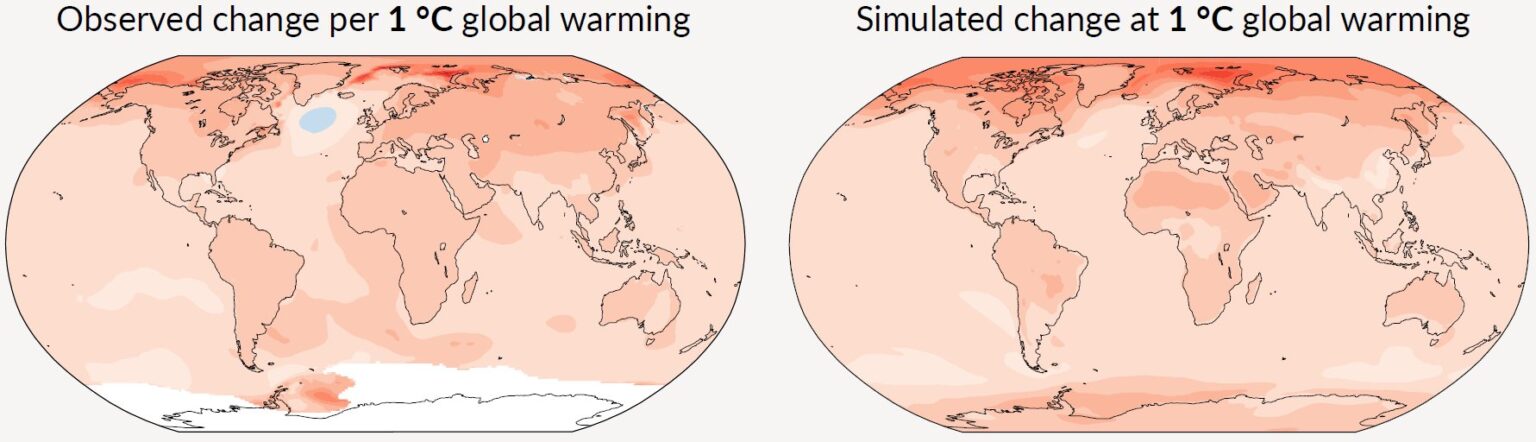
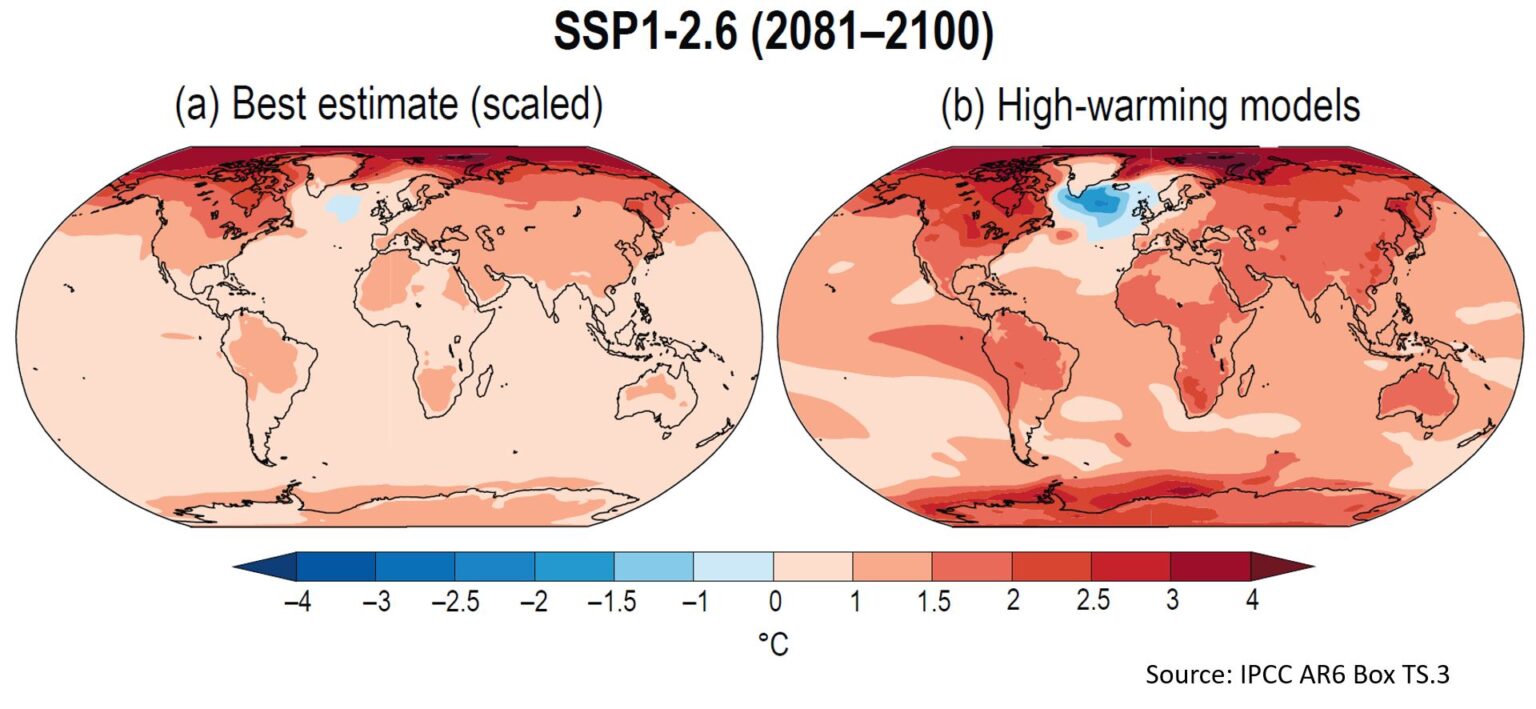
    9. Standard climate models get the observed ‘cold blob’, but only later. Here is some graphs from the current IPCC report, AR6.


    Figure 4. Observed vs simulated historic warming (normalised to 1 °C). At this stage the ‘cold blob’ is not yet seen in the model average. Source: IPCC AR6

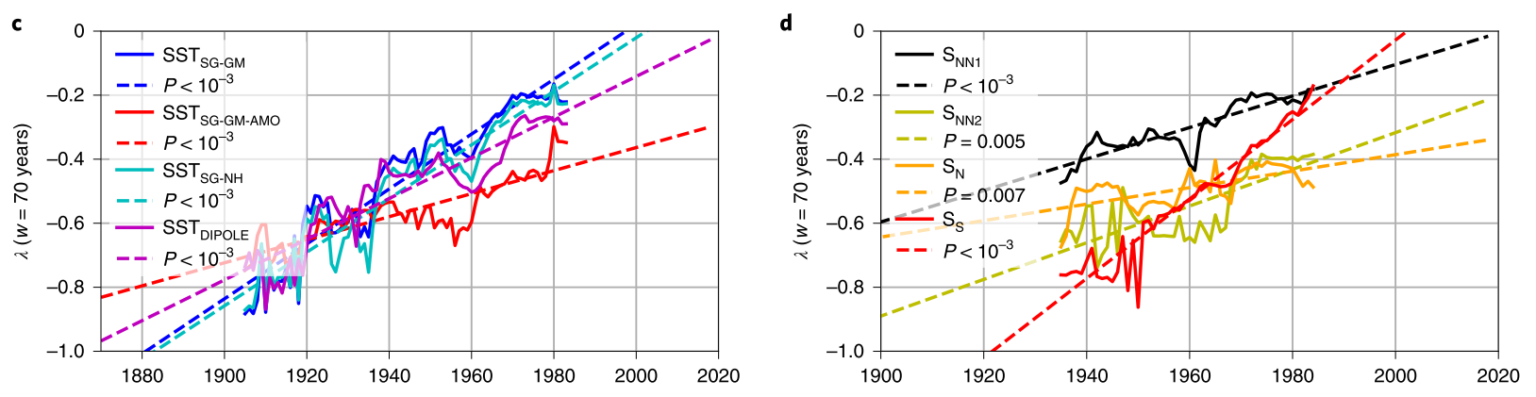
    Figure 5. Simulated warming by the end of this century. Now the ‘cold blob’ appears in the CMIP6 models.

    10. There are possible Early Warning Signals (EWS). New methods from nonlinear dynamics search for those warning signals when approaching tipping points in observational data, from cosmology to quantum systems. They use the critical slowing down, increasing variance or increasing autocorrelation in the variability of the system. There is the paper by my PIK colleague Niklas Boers (2021), which used 8 different data series (Figure 6) and concluded there is “strong evidence that the AMOC is indeed approaching a critical, bifurcation-induced transition.”


    Figure 6. Early warning signals in four temperature and four salinity based AMOC reconstructions. Note that the tipping point is reached when the lines reach a lambda value of zero. From Boers 2021.

    Another study, this time using 312 paleoclimatic proxy data series going back a millennium, is Michel et al. 2022. They argue to have found a “robust estimate, as it is based on sufficiently long observations, that the Atlantic Multidecadal Variability may now be approaching a tipping point after which the Atlantic current system might undergo a critical transition.”

    And today (update!) a third comparable study by Danish colleagues has been published, Ditlevsen & Ditlevsen 2023, which expects the tipping point already around 2050, with a 95% uncertainty range for the years 2025-2095. Individual studies always have weaknesses and limitations, but when several studies with different data and methods point to a tipping point that is already quite close, I think this risk should be taken very seriously.

    Conclusion

    Timing of the critical AMOC transition is still highly uncertain, but increasingly the evidence points to the risk being far greater than 10 % during this century – even rather worrying for the next few decades. The conservative IPCC estimate, based on climate models which are too stable and don’t get the full freshwater forcing, is in my view outdated now. I side with the recent Climate Tipping Points report by the OECD
    https://www.oecd-ilibrary.org/sites/abc5a69e-en/index.html?itemId=/content/publication/abc5a69e-en, which advised:
    Yet, the current scientific evidence unequivocally supports unprecedented, urgent and ambitious climate action to tackle the risks of climate system tipping points.

    #climat #océan #amoc #risque_systémique #agriculture #écosystèmes
    voir également https://seenthis.net/messages/1011527

    • Un truc que je viens de remarquer sur le scénario [SSP1-2.6 (b) high warming model] :
      la « bulle » bleue sur l’Atlantique Nord (ou le « cold blob » du commentaire), ça ressemble étonnamment aux conditions météo actuelles fin juillet début août. A la différence près que pour le jetstream, on a bien en ce moment un flux zonal alors que sur la carte mentionnée ci-avant, ça ressemblerait plutôt à un « cut-off low » (une goutte froide).

      A cut-off low (or cutoff low), sometimes referred to as the weatherman’s woe, is defined as “a closed upper-level low which has become completely displaced (cut off) from basic westerly current, and moves independently of that current” by the National Weather Service. Cut-off lows form in mid-latitudes (usually in the subtropics or between 20° and 45°) and would remain nearly stationary for days.[2]

      https://en.wikipedia.org/wiki/Cut-off_low

      #AMOC

  • Gulf stream could collapse as early as 2025, study suggests | Climate crisis | The Guardian
    https://www.theguardian.com/environment/2023/jul/25/gulf-stream-could-collapse-as-early-as-2025-study-suggests
    https://i.guim.co.uk/img/media/c48440be715898be21be5636ac64d179db67ec45/0_0_3500_2102/master/3500.jpg?width=1200&height=630&quality=85&auto=format&fit=crop&overlay-ali

    Prof Niklas Boers, from the Potsdam Institute for Climate Impact Research in Germany, revealed the early warning signs of Amoc collapse in 2021. “The results of the new study sound alarming but if the uncertainties in the heavily oversimplified model [of the tipping point] and in the underlying [sea temperature] data are included, then it becomes clear that these uncertainties are too large to make any reliable estimate of the time of tipping.”

    Prof David Thornalley, at University College London, UK, agreed the study had large caveats and unknowns and said further research was essential: “But if the statistics are robust and a relevant way to describe how the actual Amoc behaves, then this is a very concerning result.”

    Dr Levke Caesar, at the University of Bremen, Germany, said using sea surface temperatures as proxy data for the strength of the Amoc currents was a key source of uncertainty: “We only have direct observational data of the Amoc since 2004.”

    The extrapolation in the new analysis was reasonable, according to Prof Tim Lenton, at the University of Exeter, UK. He said the tipping point could lead to a partial Amoc collapse, for example only in the Labrador Sea, but that this would still cause major impacts. Divlitsen said he hoped the debate would drive new research: “It’s always fruitful when you do not exactly agree.”

    Prof Stefan Rahmstorf, at the University of Potsdam, Germany, said: “There is still large uncertainty where the Amoc tipping point is, but the new study adds to the evidence that it is much closer than we thought. A single study provides limited evidence, but when multiple approaches have led to similar conclusions this must be taken very seriously, especially when we’re talking about a risk that we really want to rule out with 99.9% certainty. Now we can’t even rule out crossing the tipping point in the next decade or two.”

    • le titre de l’article est trompeur (Gulf stream en lieu et place d’AMOC)

      Le Gulf Stream va-t-il sauver l’Europe du changement climatique ?
      https://bonpote.com/le-gulf-stream-va-t-il-sauver-leurope-du-changement-climatique

      Après avoir quitté la côte américaine, une partie de l’eau transportée par le #Gulf_Stream (de l’ordre de 20 %) circule, en surface, vers le nord, puis traverse le bassin d’ouest en est vers 50°N. Ensuite elle rejoint soit les mers d’Irminger et du Labrador qui entourent la pointe Sud du Groenland, soit encore plus au nord les côtes norvégiennes.

      La chaleur transportée est transférée dans l’atmosphère, surtout en hiver, ce qui rend l’eau en surface plus lourde. C’est pourquoi dans ce parcours, elle a tendance à “couler” en profondeur où elle alimente les courants profonds qui s’orientent en moyenne vers le sud.

      Dans l’ensemble, cette circulation occupe tout l’#océan_Atlantique, et s’oriente vers le nord proche de la surface et vers le sud en profondeur, ce qui décrit une boucle de retournement, d’où la dénomination française de circulation de retournement (et en anglais #AMOC pour Atlantic Meridional Overturning Circulation).

      Ce qu’il faut surtout retenir, c’est que cette circulation n’est pas un seul courant, mais une moyenne, une construction mathématique qui regroupe, fusionne plusieurs courants différents dans tout l’Atlantique Nord, dont le Gulf Stream. Sa définition ne s’arrête pas à l’équateur : on la calcule aussi dans l’hémisphère sud et dans tous les autres bassins.

      Comment connaît-on ces phénomènes et comment les étudie-t-on ?
      Comment observe-t-on le Gulf Stream ?

      Le Gulf Stream, courant océanique bien connu des marins depuis le XVIème siècle et dont la température chaude est mesurée dès le XVIIIème par Benjamin Franklin, est observé régulièrement par des navires océanographiques depuis bientôt un siècle. On mesure son intensité en continu grâce à un câble sous-marin entre la Floride et les Bahamas depuis les années 1980. On l’observe par satellite depuis les années 1990. La situation n’a rien de comparable pour la circulation de retournement…

      Comment observe-t-on la circulation de retournement ?
      Depuis 2004, un ensemble d’instruments océanographiques sont disposés le long d’une ligne imaginaire qui relie la côte Est des États-Unis à l’Afrique à la latitude 26°N, de la surface jusqu’au fond de l’océan. Cette section océanographique permet de mesurer en continu l’intensité de la circulation de retournement.

      Parce que ces observations directes restent peu nombreuses, les océanographes ont beaucoup recours aux modèles numériques pour étudier la circulation de retournement et ses impacts. Ces outils, basés sur la mécanique des fluides, les mathématiques et les sciences du calcul intensif, permettent de réaliser des expériences virtuelles pour tester des hypothèses (quel serait l’impact sur le climat en Europe d’un arrêt de la circulation de retournement ?) et tenter de reproduire les océans actuels, passés et futurs.

      Enfin, les paléo-océanographes essaient de reconstruire les fluctuations de la circulation de retournement en utilisant des mesures indirectes de son intensité, estimées à partir de divers prélèvements sédimentaires terrestres et marins.

      Historiquement, on pensait que la circulation de retournement était entraînée presque exclusivement par les contrastes, liés à la température et la salinité (d’où la dénomination de circulation “thermohaline”). On sait maintenant que d’autres processus physiques l’influencent, comme le vent et le mélange océanique.

      On sait aussi, notamment grâce aux modèles numériques et aux mesures directes récentes, qu’elle fluctue beaucoup d’un mois sur l’autre, d’un an sur l’autre, d’une décennie sur l’autre, d’un siècle sur l’autre… et que ces fluctuations peuvent être déclenchées par de nombreux processus différents (parmi lesquels la fonte du Groenland, mais pas que…).

      L’un des courants marins les plus complexes au monde
      Le Gulf Stream est également lui-même un des courants marins les plus complexes au monde car sous influence de multiples processus. La circulation de retournement hérite de cette complexité. Mais en tant que construction mathématique qui fusionne plusieurs courants marins dont le Gulf Stream, elle est aussi influencée par d’autres processus océaniques.

      On entend parfois que la circulation de retournement n’existe pas car les mesures RAPID à 26°N ne correspondent pas à celles prises plus au sud ou plus au nord. Ces différences, au contraire, illustrent bien que la circulation de retournement n’est pas un simple tapis roulant qui connecte l’océan Atlantique du sud au nord, comme des représentations simplifiées de l’océan ont pu le laisser à penser.

    • Scientists have long seen the Atlantic Meridional Overturning Circulation, or AMOC, as one of the planet’s most vulnerable “tipping elements” — meaning the system could undergo an abrupt and irreversible change, with dramatic consequences for the rest of the globe.
      Under Earth’s current climate, this aquatic conveyor belt transports warm, salty water from the tropics to the North Atlantic, and then sends colder water back south along the ocean floor. But as rising global temperatures melt Arctic ice, the resulting influx of cold freshwater has thrown a wrench in the system — and could shut it down entirely.

      https://www.washingtonpost.com/climate-environment/2023/07/25/atlantic-ocean-amoc-climate-change

      #AMOC : Atlantic Meridional Overturning Circulation (Circulation méridienne de retournement de l’Atlantique)

    • Les effets estimés d’un arrêt de l’AMOC :


      À gauche les températures, à droite les précipitations. À noter que ces valeurs sont une moyenne annuelle, or un des effets de l’arrêt de l’AMOC notamment dans les hautes latitudes serait un renforcement de la saisonnalité, chose qui n’est pas reflétée par les valeurs annuelles.
      L’Europe serait « sibérianisée », avec des hivers nettement plus longs (car commençant plus tôt) et plus froids (surtout en Europe du Nord), des étés plus courts (mais pas forcément plus frais), et des pluies en diminution (jusqu’à moitié moins sur la péninsule ibérique) car un Atlantique Nord plus froid évaporerait moins. On estime que la surface cultivable en blé et maïs en Europe serait réduite de plus de moitié.
      En Amérique du Nord il y aurait augmentation de la pluviométrie mais sous forme de tempêtes plus fréquentes.
      En Afrique de l’Ouest la zone très peuplée entre Sénégal et Gabon subirait une sécheresse et un réchauffement accrus (car la chaleur n’étant plus transportée vers le nord s’accumulerait dans les tropiques)
      Tout l’hémisphère Sud se réchaufferait, et la forêt amazonienne disparaîtrait encore plus vite sous l’effet de sécheresses accentuées (en relarguant son carbone au passage).
      Les courants de Humbolt (Chili Pérou) et du Benguéla (Namibie Angola) s’affaibliraient, la pêche dans ces secteurs (très importante aujourd’hui) ne donnerait plus grand chose, et l’océan global perdrait beaucoup de sa productivité et de sa capacité à absorber le CO2. Maigre consolation les déserts d’Atacama et du Namib seraient moins désertiques, le Nord-Est brésilien moins aride, mais probablement pas de quoi accueillir des centaines de millions de réfugiés climatiques.

    • d’après cette simulation la Méditerranée et l’Afrique du Nord seraient également touchées par le refroidissement de l’Atlantique Nord, la chaleur resterait piégée plus au Sud. Si on y ajoute la baisse des précipitations dans tout le pourtour méditerranéen, le Sahara s’étendrait en quelque-sorte à la fois sur le Maghreb et sur le Sahel.

  • El Niño : un retour qui inquiète. Les prévisionnistes anticipent de nouveaux #records_de_chaleur sur la planète.

    El Niño est de retour. Après trois ans d’absence, cette anomalie météorologique s’apprête à souffler les températures les plus élevées enregistrées sur Terre depuis l’ère préindustrielle, anticipent les prévisionnistes du Met Office britannique. « La température moyenne mondiale pour 2023 devrait se situer entre 1,08 °C et 1,32 °C (avec une estimation centrale de 1,20 °C) au-dessus de la moyenne observée depuis un siècle », rapporte Nick Dunstone, qui a dirigé cette étude notée avec un degré de certitude de 66 %. Si ces prévisions se confirment, les #catastrophes climatiques pourraient connaître leur apogée avec notamment « des vagues de chaleur sans précédent ». […]

    Le retour d’#El_Niño tombe au plus mauvais moment car les scientifiques craignent qu’il se conjugue avec le ralentissement brutal du #Gulf_Stream, un des principaux moteurs de régulation climatique. Une étude du Potsdam Institute for Climate Impact Research, publiée en 2021, s’est alarmée du possible effondrement de ce système. […]

    « Nos résultats confortent l’hypothèse que le déclin de l’#AMOC (’#Atlantic_meridional_overturning_circulation ’) n’est pas juste une fluctuation ou une réponse linéaire à l’augmentation des températures, mais signifie plutôt que l’on s’approche d’un seuil critique après lequel le système de circulation de l’eau peut s’effondrer », estime Stefan Rahmstorf qui a dirigé cette étude. […]

    Ce dérèglement est sans doute le fruit d’un emballement diabolique. Avec le réchauffement planétaire, la fonte des grands glaciers s’accélère. « L’apport d’eau douce du Groenland et la hausse des #précipitations dans cette région diluent l’eau de mer et grippent le système », explique Stefan Rahmstorf. En analysant des carottes sédimentaires collectées dans le golfe de Guinée, une équipe de paléoclimatologues a pu reconstituer un épisode similaire qui s’est produit sur terre il y a 125.000 ans. « La cascade d’effets que nous avons mis en lumière augure le pire ». […]

    « Ce changement conduira probablement à ce que la #température_mondiale en 2023 soit plus chaude qu’en 2022 ». […]

    Les conséquences pourraient être dévastatrices : assèchement de la #forêt_amazonienne, fournaise en Australie et aux Etats-Unis, #hiver plus intense au nord de l’Europe, déluges au Sud, accélération des émissions de méthane…

    (Les Échos)

    #réchauffement_climatique

  • #Bleu_pétrole

    Le combat d’un homme pour que les pollueurs soient les payeurs.

    16 mars 1978 : le pétrolier #Amoco_Cadiz s’échoue sur les rochers de #Portsall, dans le #Finistère. 220 000 tonnes de #pétrole brut sont déversées sur près de 400 kilomètres de côtes bretonnes, provoquant l’une des plus grandes marées noires du siècle. Léon, le maire de la petite commune, décide de poursuivre les responsables et engage la lutte contre la firme propriétaire du chargement de l’Amoco, jusqu’aux procès aux États-Unis qui durera quatorze ans. À ses côtés, sa fille Bleu vit de plein fouet la catastrophe et s’en fait le témoin. Elle nous livre ses souvenirs : leur vie de famille et les liens qui les unissent. L’espoir. La persévérance. Bleu Pétrole est leur histoire.


    https://www.angle.fr/bd-bleu-petrole-9782818941898.html
    #BD #bande_dessinée #marée_noire #Bretagne #France #marée_noire #résistance #procès #justice #livre #pollution

  • "Mazouté aujourd’hui, radioactif demain"


    https://www.reddit.com/r/HistoryPorn/comments/6ymx3o/the_oil_tanker_amoco_cadiz_ran_aground_off_the
    https://www.franceculture.fr/emissions/une-histoire-particuliere-un-recit-documentaire-en-deux-parties/que-reste-t-il-de-lamoco-cadiz-12-a-bord-de-lamoco-cadiz

    https://www.franceculture.fr/emissions/une-histoire-particuliere-un-recit-documentaire-en-deux-parties/que-reste-t-il-de-lamoco-cadiz-22-le-fantome-de-lamoco-cadiz

    Se réveiller au cœur de la nuit et être surpris par une #marée_noire sous sa fenêtre, voilà ce qui vous fait passer la peur du loup. François Talarmin sort à peine de l’enfance. Dès le matin il chausse ses bottes pour se rendre sur le rivage, la côte de #Portsall. Ce jour-là, plus une vague, pas un oiseau, plus de mer… L’enfant aperçoit un pétrolier de 334 mètres de long éventré sur les rochers et vomissant une liqueur noire à l’odeur nauséabonde. Un monstre, un fantôme a surgi dans la nuit. L’Amoco Cadiz devient aussi le nom d’une prise de conscience, celle du dommage écologique.


    #Amoco_Cadiz
    Une histoire particulière, un récit documentaire en 2 parties, le samedi et le dimanche de 13.30 à 14h sur #France_Culture

  • Le jour où l’Amoco Cadiz s’est brisé en deux - Edition du soir Ouest France - 15/03/2018
    https://www.ouest-france.fr/leditiondusoir/data/21545/reader/reader.html?t=1521134725707#!preferred/1/package/21545/pub/30965/page/11
    https://www.ouest-france.fr/leditiondusoir/data/21545/NextGenData/Image-1024-1024-4510124.jpg?t=%22abd69d23ff97e26b15e99697098b13dcgzip%2

    Il y a 40 ans, la #Bretagne se réveille en colère, désabusée. Elle doit faire face à une nouvelle #catastrophe_pétrolière. Le pétrolier libérien #Amoco_Cadiz s’est échoué à moins de deux milles des côtes du Nord #Finistère. Brisé en deux, le navire laisse le liquide visqueux se disperser en mer et recouvrir la côte et les plages. Que s’est-il passé la veille et pendant la nuit ?

    https://www.ouest-france.fr/leditiondusoir/data/21545/NextGenData/Image-1024-1024-4510131.jpg?t=%22abd69d23ff97e26b15e99697098b13dcgzip%2
    #Ouest_France

  • Le 16 mars 1978, l’échouement de l’#Amoco_Cadiz provoque une #marée_noire gigantesque.

    Le 16 mars 1978 au matin, à l’entrée sud de la Manche, à proximité des côtes bretonnes par une mer très formée, l’Amoco-Cadiz vogue à proximité des côtes bretonnes. Ce pétrolier géant de 330 m de long affrété par la société #Shell, appartient à la Phillips, une compagnie de Chicago implantée aux Bermudes. Immatriculé au Libéria, le navire transporte 227 000 tonnes de #pétrole brut du Golfe Persique à destination de Rotterdam aux Pays-Bas.

    http://lhistgeobox.blogspot.fr/2018/03/le-16-mars-1978-lechouement-de-lamoco.html

    #pollution #bretagne

  • Oceans Are Absorbing Almost All of the Globe’s Excess Heat

    Since 1955, more than 90 percent of the excess heat retained by the Earth as a result of increased greenhouse gases has been absorbed by the #oceans, leaving ocean scientists like Eric Leuliette at the National Oceanic and Atmospheric Administration feeling that 90 percent of the #climate change story is being ignored.

    http://www.nytimes.com/interactive/2016/09/12/science/earth/ocean-warming-climate-change.html

  • D’après la NASA la circulation thermohaline pourrait bien être en train de s’arrêter…


    NASA found a way to track ocean currents from space. What they saw is troubling - The Washington Post
    https://www.washingtonpost.com/news/energy-environment/wp/2015/11/04/nasa-can-now-detect-worrying-ocean-circulation-changes-from-space

    There has been growing concern, of late, that one predicted consequence of a changing climate — the slowing of the great “overturning” circulation in the Atlantic Ocean — is already starting to happen.

    #changement_climatique #it_has_begun

  • #WikiLeaks. Les coulisses de l’Amoco - Bretagne - Le Télégramme, quotidien de la Bretagne
    http://www.letelegramme.fr/france/wikileaks-les-coulisses-de-l-amoco-13-09-2015-10771754.php

    3 mois après le naufrage de l’Amoco Cadiz,

    En complément
    L’incident n’avait jusqu’ici jamais été dévoilé. Le 21 juin 1978, le porte-avions géant américain Nimitz, mis en service trois ans plus tôt, croise près d’Ouessant. Trop près. Selon le télégramme classé « secret » qu’expédie l’ambassade américaine à Washington, le bateau est « entré par inadvertance » dans la zone interdite des cinq milles (9,2 km) du rail d’Ouessant. « Une zone où la Marine française effectue régulièrement des patrouilles depuis la marée noire de l’Amoco Cadiz. »
    La violation est même double, puisqu’une loi française, juridiquement contestée (droit de passage consacré au niveau international), établit depuis 1965 « une zone interdite de 12 milles à tous les navires à propulsion nucléaire (†) ». « Cette loi est au centre des négociations avec les Français concernant les escales des navires de guerre à propulsion nucléaire », pointe l’ambassadeur américain à Paris.

    Provoquer le gouvernement français ?
    L’incident est-il uniquement le fruit de la tension engendrée par le naufrage de l’Amoco, ou bien est-ce une manière de peser dans les négociations en cours ? L’ambassadeur « souhaite s’assurer que Washington est bien au fait des répercussions politiques qui pourraient survenir ». Et pose une « question immédiate » : le Nimitz devra-t-il se plier aux injonctions françaises pour son trajet retour ? Si l’incident se renouvelle, la Marine française, qui « semble vouloir garder cela entre elle et l’US Navy », « peut se sentir obligée de le faire remonter à l’échelle politique », met en garde Hartman. « Si tel était le cas, nos efforts actuels pour obtenir un accord pourraient être compromis ». Même s’il note que la Marine française « a elle-même à faire face à des enjeux futurs sur cette question », l’ambassadeur recommande finalement « d’éviter de provoquer le gouvernement français ».

    A-t-il été entendu ? Aucun télégramme de réponse ou de nouvel incident ne semble avoir été diffusé. Côté français, le service historique de la Marine dit n’avoir trouvé aucune trace de cet incident dans ses archives...

    Un sous-marin nucléaire américain à Brest
    Il a fallu attendre janvier 1982 pour qu’un décret conforte définitivement « le droit de passage inoffensif de tous les navires », sans distinction, dans nos eaux territoriales. Le même décret est venu réglementer les conditions d’accès des navires étrangers à propulsion nucléaire dans les ports français (autorisation préalable). Deux mois plus tard, les autorités françaises autorisaient l’escale d’un sous-marin nucléaire d’attaque américain, le Sturgeon, dans le port de Brest.

    –------------------
    † Demande préalable exigée (vérification de garantie financière en cas de dommages nucléaires).