Homogeneous Wheat Diets Leave the World Exposed to War Impacts on Food Supplies
▻https://www.bloomberg.com/graphics/2022-global-diet-homogeneous-food-security-risk

#datavisualisation #bouffe #céréales #agriculture #petite_planète
Homogeneous Wheat Diets Leave the World Exposed to War Impacts on Food Supplies
▻https://www.bloomberg.com/graphics/2022-global-diet-homogeneous-food-security-risk
#datavisualisation #bouffe #céréales #agriculture #petite_planète

Synthèse Patients Covid-19 en France
▻https://mapthenews.maps.arcgis.com/apps/opsdashboard/index.html#/5df19abcf8714bc590a3b143e14a548c
En complément de ▻https://seenthis.net/messages/831671, la visualisation des stats spécifiquement pour la France (totalité ou par département)
Voir entre autre l’onglet « Capacités de réanimation » sur la carte de droite
A Timeline of Historical Pandemics
▻https://public.flourish.studio/visualisation/1582870/embed?auto=1
Visualisation interactive des grandes épidémies dans l’histoire (peste, grippe espagnole...)
Coronavirus COVID-19 (2019-nCoV)
►https://www.arcgis.com/apps/opsdashboard/index.html#/bda7594740fd40299423467b48e9ecf6
Infographie cartographique très complète et interactive des statistiques du COVID-19

AMA with The Economist’s data team - Newsletter | DataJournalism.com
▻https://datajournalism.com/read/newsletters/ama-with-the-economists-data-team
In 1843, The Economist’s inaugural edition went to print with a table front and centre. Clearly ahead of his time, the editor of the day recognised the power of data journalism over a 100 years before the field’s modern emergence.
Almost 176 years later and the outlet’s appetite for data driven stories is still going strong. In 2015, they brought in a specialised data team and, this year, they launched a dedicated data section in print.
To find out more about The Economist’s affinity with data, we let you pose your burning questions to the data team themselves. Here’s what they had to say!
#datavisualisation #visualisation #datajournalisme #journalisme_de_donnée #The_economist
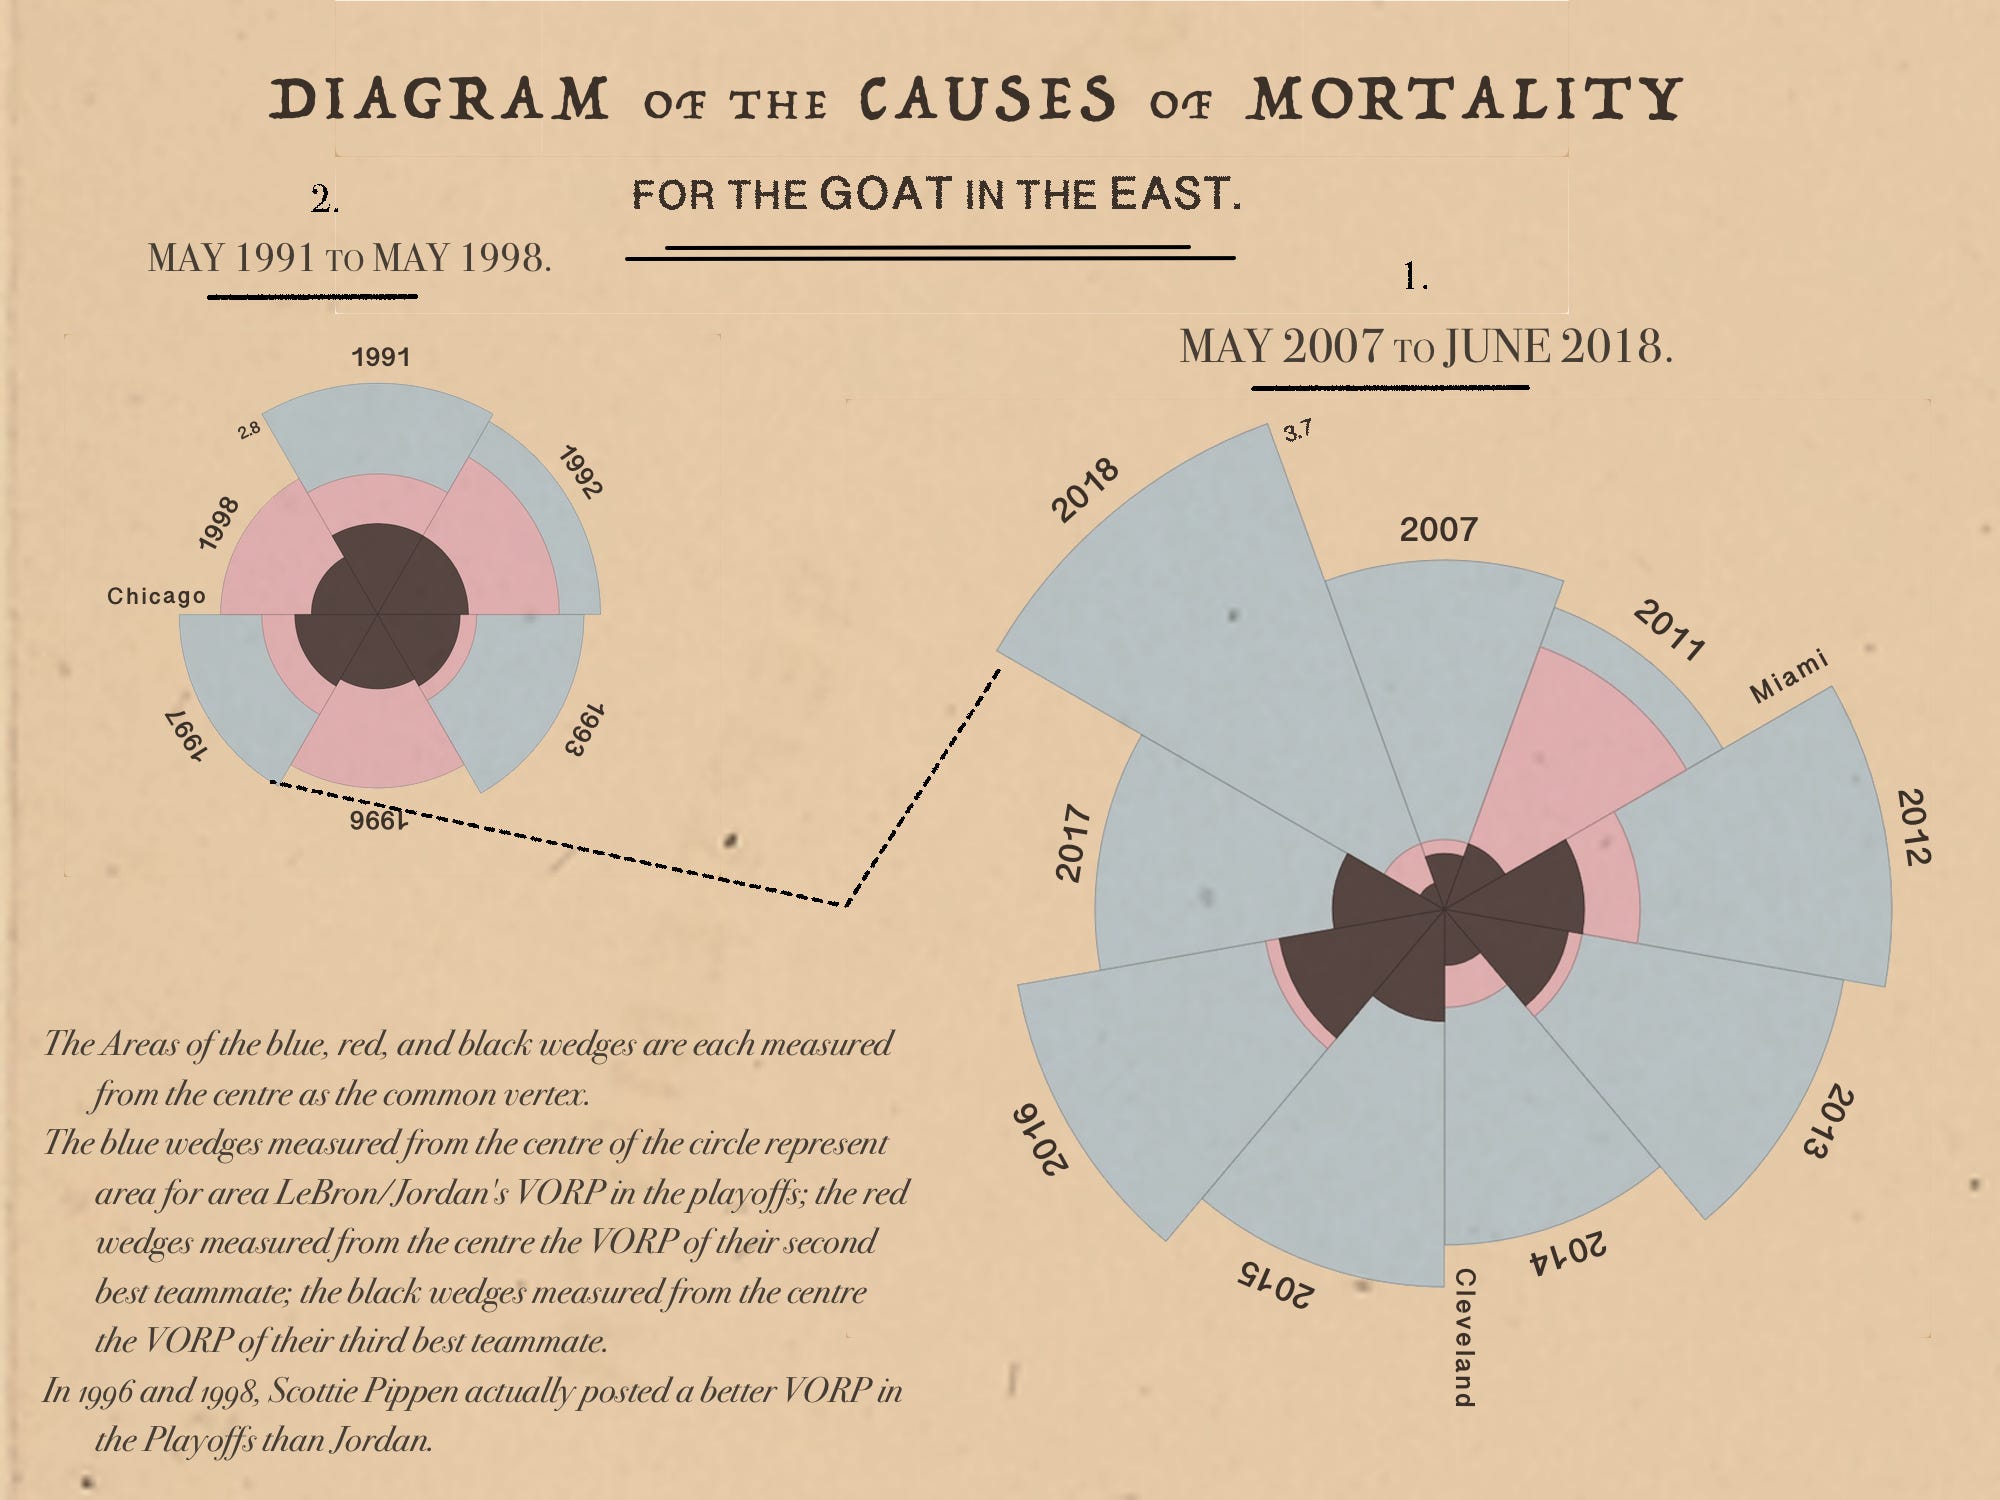
From the Battlefield to Basketball: A Data Visualization Journey with Florence Nightingale
▻https://medium.com/nightingale/from-the-battlefield-to-basketball-a-data-visualization-journey-with-florenc
1858, Florence Nightingale published a study on the conditions of army hospitals, her seminal Notes on Matters Affecting the Health, Efficiency, and Hospital Administration of the British Army. Her Diagram of the Causes of Mortality had a singular goal: to vividly demonstrate that the lack of proper sanitary caretaking facilities was a far more severe, but also far more avoidable, cause of death for soldiers than injuries suffered in battle. It’s one thing to simply state that the disease killed a lot of soldiers. It’s another thing entirely to effectively and actionably juxtapose it against the casualties encountered at the hands of the opposing army.
–—
Beyond Nightingale: Being a Woman in Data Visualization
▻https://medium.com/nightingale/beyond-nightingale-being-a-woman-in-data-visualization-d7968d171ccf
you conduct a quick internet search on “history of data visualization,” you’ll nearly always see Florence Nightingale included in the annals of history. Why? It’s not like a Nightingale Rose chart is easy to read, or a cinch to make, or even all that common.
#visualisation #cartographie #précurseurs #précurseuses #datavisualisation #visualisation_de_données #Florence_Nightingale #féminisme
Measures of Inequity - Ibghy & Lemmens
▻http://www.ibghylemmens.com/Measures_of_Inequity.html
Selezione “La Lettura” 2015-2018 | Federica Fragapane • Wild Mazzini
▻http://www.wildmazzini.com/project/lettura-2015-2018-fragapane
 http://www.wildmazzini.com/wp-content/uploads/2018/06/Van-Gogh-Fragapane-LALettura-Wild-Mazzini.jpg
  http://www.wildmazzini.com/wp-content/uploads/2018/06/20a.Creativita.jpeg
  http://www.wildmazzini.com/wp-content/uploads/2018/06/02.Lingue-e-traduzioni.jpeg
  http://www.wildmazzini.com/wp-content/uploads/2018/06/11.Posti-immaginari.jpeg
 Acquistare il giornale in edicola o leggerlo al bar è stato, e per alcuni lo è ancora, un rito, un gesto che porta a contatto con la realtà. Prima della rete, prima della televisione e della radio, il giornale rappresentava il luogo d’incontro delle comunità e del Paese, un punto di partenza per acquisire informazioni, forse anche competenze, e poi discutere e confrontarsi con gli altri.
Ora questo processo è parcellizzato e moltiplicato in decine di contesti comunicativi che a differenza del giornale cartaceo, vincolato dalla foliazione e dal formato, dal numero di battute e da una lunga serie di elementi grafici, possono fluire e modificare a proprio piacimento le dimensioni di una notizia. Basti pensare alle reti all news, alla facilità di aggiornare più volte un articolo su un sito web o all’infinita possibilità di condivisione di un post sui social network.
#datavisualisation #journalisme_de_données #infographies #représentations_visuelles #art
En décembre 2011, l’Université de Neuchâtel organisait une magnifique exposition sur l’histoire de la cartographie, infographie, data visualisation (puisque c’est un terme à la mode) - dans le cadre des activités de « l’Académie du journalisme et des médias »
L’exposition a été conçue en collaboration (si je ne me trompe pas) de Michael Stoll, Professeur à l’ « Augsburg University of Applied Sciences (Allemagne) » et aussi prof associé à l’université de Neuchâtel.
▻https://www.flickr.com/photos/mstoll/5805887958/sizes/l
A l’occasion du classement de mes archives, j’avais envie de partager avec vous quelques images et quelques liens généraux sur la "visualisation des données, en complément de ce que nous commençons à publier sur nos chers précurseurs (Otto Neurath, Jacques Bertin, Charles-Joseph Minard). Une manière de regrouper un peu d’intelligence cartographique dans un même lieu pour accéder facilement aux références.
pdf téléchargeable de la présentation de Benjamin Wiederkehr lors du vernissage de l’expoition en décembre 20011. Un documents riches d’exemples et très intéressant du point de vue du processus de création infographique et icônique.
▻http://marcogiardina.ch/infographics/History%20Of%20Infographics%20Exhibition%20(2011).pdf
pdf téléchargeable de la présentation de Michael Stoll lors du vernissage. Ce document très complet donne une très bonne idée de ce à quoi ressemblait l’exposition.
▻http://marcogiardina.ch/infographics/stoll_talk_grand_opening.pdf
grande série de photos de l’exposition consutable sur Flickr
▻https://www.flickr.com/photos/mstoll/5805922134/in/photostream
▻https://www.flickr.com/photos/mstoll/5805863770/sizes/l
Il y a aussi un petit documentaire disponible ici :
▻http://marcogiardina.ch/infographics/2011_12_12_infography_exhibit_neuch%C3%A2tel.mp4
Et un film beaucoup plus long (1h30) sur l’histoire de l’infographie
About the History of Infographics
An Exhibition/Exposition AJM (UniNE) - HD
▻https://www.youtube.com/watch?v=cqEmnaRHG4Y
Pour mémoire et en complément, deux autres conférences de deux personnalité des la data visualisation qui ont le vent en poupe, très présents sur les réseaux sociaux :
Alberto Cairo
The Functional Art - Design and Infographics | Journalism Interactive Conference 2013
▻https://www.youtube.com/watch?v=PHReSOa4H4g
The beauty of data visualization
▻https://www.youtube.com/watch?v=5Zg-C8AAIGg
Et pour le fun et la mémoire, feu le formidable Hans Rosling dans une de ses premières conférences.
▻https://www.youtube.com/watch?v=usdJgEwMinM
#infographie #cartographie #visualisation #neuchâtel #datavisualisation
The Python Graph Gallery | Resources | Data Driven Journalism
▻http://datadrivenjournalism.net/resources/the_python_graph_gallery
Data journalism is a field closely related with data science. To write an article, data journalists have to follow the traditional steps of any data driven project. These include exploratory and explanatory analysis, and data visualization is a key step in both.
During exploratory analysis, journalists must be able to quickly understand their data through simple graphics, going quickly from one chart to another to answer their questions. Once interesting results are discovered, data visualization is often used to showcase these results. But for a story to be eye-catching and easy to understand, the journalist will often spend a lot of time customizing the graphic. .
Is Excel 2018 going to be the game changer in data visualization? – DataVis Experts
▻http://datavisxperts.com/excel-2018-and-datavis
I am afraid not.
Is Excel 2018 going to be the game changer in data visualization?
Tech giant Microsoft recently announced a ton of new features that it would be adding to our old pal Excel. Perhaps its time and God knows Excel has waited long enough for a major upgrade. But what will this upgrade actually do? Will it really live up to the buzz its announcement stirred up? And what are these new data types that they are talking about? We will try to answer all these queries here. Let’s dive in !

“It is meant to take any list of data and then start to generate insights”. Spataro [Microsoft’s general manager for Office] also said, “It will look at combinations, charts, pivot tables and it will recognize those that are most interesting by looking at outliers, looking at trends in the data, looking at things that represent changes.” It is named #INSIGHTS as of now. And machine learning is also being incorporated into this in order to facilitate the ability to take data from other services using APIs.
En fait, ce qu’on met maintenant sous le mot visualisation, c’est le processus de réflexion et d’interprétation des données dont celle-ci n’est que le résultat. Si, en plus, l’outil magique qui fait tout tout seul et pense pour vous intègre du machine learning, les #lendemains_qui_chantent, c’est pour… demain, enfin, pour la date de sortie d’Excel 2018.
Si on retombe sur ses pieds, il faut comprendre que la lutte avec gg:sheets est féroce, notamment autour de l’interface de réalisation des graphiques pour laquelle gg avait pris une nette avance. Avance que M$ avait en partie rattrapée avec Excel 2016 où l’interface des graphiques proposait, déjà, des « graphiques recommandés » et incorporait de nouveaux types de graphique introduit par gg, comme le treemap. En forçant le trait, ce qui est (sera ?) nouveau, c’est que la « recommandation » se revendiquera d’une intelligence en boîte (le fameux ML…)
btw #merci !
Data visualisation: it is not all about technology
▻https://www.ft.com/content/aba6c58e-5a8e-11e7-9bc8-8055f264aa8b
▻http://prod-upp-image-read.ft.com/10b127ca-5b4e-11e7-9bc8-8055f264aa8b
Anyone who recently bought an exploding smartphone or spent hours sleeping on the floor at Heathrow’s Terminal 5 might be inclined to agree with American inventor Danny Hillis’s definition of technology as “everything that doesn’t work yet”.
As a society, we continue to be obsessed with the latest technology. And as data visualisation enthusiasts, we continue to be seduced by the latest tools, rarely questioning whether novelty leads to better results.
#visualisation #représentation #Statistiques #datavisualisation
Readers often ask me what software we use to make charts at the Financial Times. No chart has generated more questions of this type recently than the Sankey diagrams, which we have used frequently this year to explain shifts in voting patterns in elections across Europe.
Visualización sobre el Observatorio del Cambio Global en Sierra Nevada
▻http://www.carmentorrecillas.com
 https://static.wixstatic.com/media/48ad71_602d452ab6004702a69714a51581b59d~mv2.jpg/v1/fill/w_981,h_464,al_c,q_90/48ad71_602d452ab6004702a69714a51581b59d~mv2.jpg
  https://static.wixstatic.com/media/48ad71_ab70f2e4af18421dab1f0f2900bcda20~mv2.jpg/v1/fill/w_981,h_437,al_c,q_90/48ad71_ab70f2e4af18421dab1f0f2900bcda20~mv2.jpg
 El trabajo de visualización aquí presentado surge del deseo por sintetizar y visibilizar en un sólo documento gráfico la polifacética estructura metodológica del Programa de Seguimiento que el Observatorio de Cambio Global tiene desplegado para evaluar los efectos del cambio global en Sierra Nevada. Dicho proyecto, cuyo origen se remonta a la iniciativa GLOCHAMORE (Global Change in Mountain Regions) auspiciada por la UNESCO, sitúa a Sierra Nevada como una de las 28 Reservas de la Biosfera de Montaña mundiales (BRs) convertida así en privilegiado observatorio natural.
To Build a Better Ballot
▻http://ncase.me/ballot
#vote #algorithme #datavisualisation
remember Kenneth Arrow? The infamous mathematician who founded the study of voting systems in the 1950’s? Well, in an interview 60 years later, Kenneth Arrow had this to say, about which voting method he likes most now:
“Well, I’m a little inclined to think that score systems [like Approval & Score Voting] where you categorize in maybe three or four classes [so, giving a score out of 3 or 4, not 10 or 100] probably – in spite of what I said about manipulation [strategic voting] – is probably the best.”
D3.js transitions killed my CPU ! A #d3.js & #pixi.js comparison | OCTO
►http://blog.octo.com/en/d3-js-transitions-killed-my-cpu-a-d3-js-pixi-js-comparison
Data Exploration and Storytelling : Finding Stories in Data with Exploratory Analysis and Visualization
▻http://journalismcourses.org/DES17.html
Un mooc sur la datavisualisation. Je me suis inscrit, pour voir...
Welcome to the Massive Open Online Course (MOOC) “Data Exploration and Storytelling: Finding Stories in Data with Exploratory Analysis and Visualization,” offered by the Knight Center for Journalism in the Americas at the University of Texas at Austin. This is a free course open to anyone from anywhere in the world interested in data-journalism. Instructors Alberto Cairo and Heather Krause will teach how to extract journalistic stories from data using visualization, exploratory data analysis and other techniques. Learn more details below about this program and if you have any questions, please contact us at knightcenter@austin.utexas.edu.
#datavisualisation #visualisation #sémiologie #mooc #atelier_cartographique

#Facebook et ses algorithmes, une enquête en 3 parties
►https://labs.rs/en/facebook-algorithmic-factory-immaterial-labour-and-data-harvesting
1. Data collection – Immaterial Labour and Data harvesting
2. Storage and Algorithmic processing – Human Data Banks and Algorithmic Labour
3. Targeting – Quantified lives on discount
#Datavisualisation #Surveillance #Silicon_army
▻https://twitter.com/arnoferrat/status/777428166780551168
▻https://twitter.com/arnoferrat/status/777445534973952000
Au passage, je découvre le moteur de recherche de brevets de Google, qui permet d’avoir une présentation des centaines d’algorithmes déposés par Facebook.
▻https://www.google.rs/search?tbm=pts&hl=en&q=inassignee%3A%22Facebook%2C+Inc.%22+

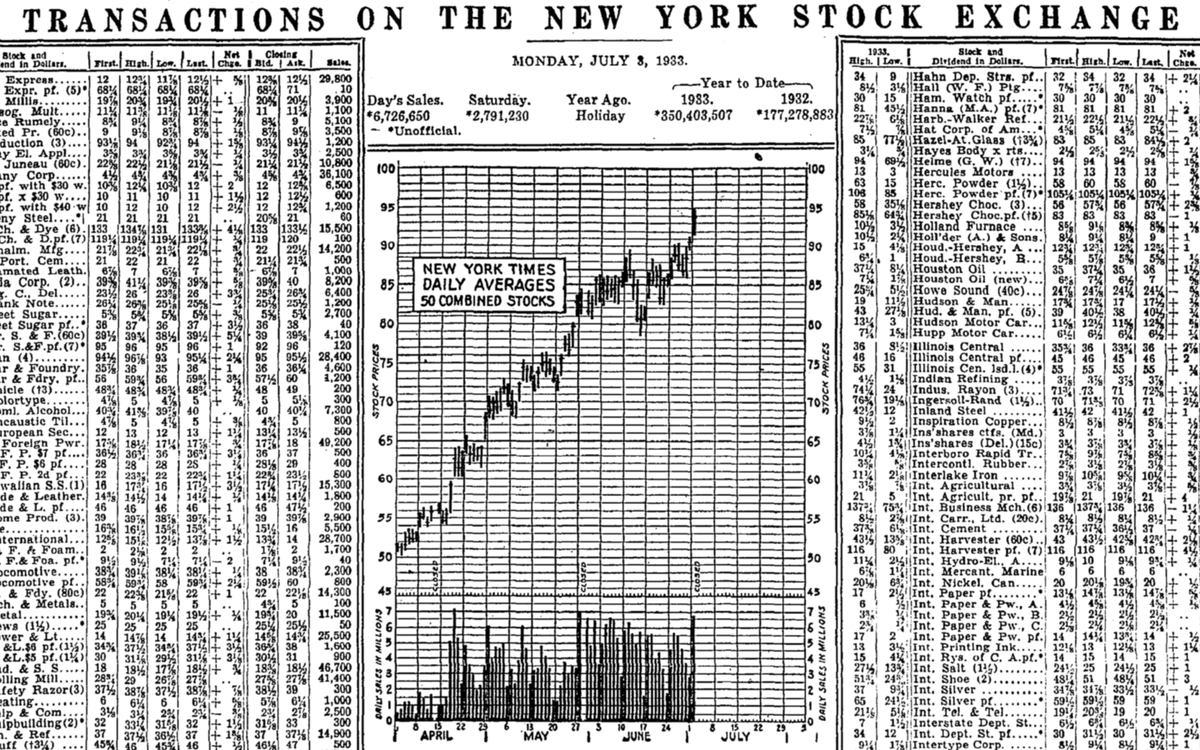
When Did Charts Become Popular ?
▻https://priceonomics.com/when-did-charts-become-popular

Stop Using Google Trends
▻https://motherboard.vice.com/read/stop-using-google-trends
And we can see this with the most recent Google Trends Freaking Outrage (GTFO), like this Washington Post story titled “The British are frantically Googling what the E.U. is, hours after voting to leave it.”
They note that searches about the EU tripled. But how many people is that? Are they voters? Are they eligible to vote? Were they Leave or Remain? Trends doesn’t tell us, all it does is give us a nice graph with a huge peak. More likely, it’s a very small number of people, based on this graph that puts it in context with other searches in the region:
[...]
But it’s giving plenty of people cover to insult the entire country, when it’s likely just a few people searching for something in a way that they always search for something. It makes “The British are frantically Googling what the EU is, hours after voting to leave it” absurdly disingenuous without better numbers. Remy Smith points this out: The peak was merely ~1000 people! It’s ludicrous that so few people get turned into a massive story, but it underscores the need for context.
#Datavisualisation #Donnée #Google_Search #Google_Trends #Internet #Moteur_de_recherche #Politique #Sociologie #Statistique


Visualisation de données, dessiner pour informer et comprendre…
La #datavisualisation est l’étude et la mise en image d’informations, de données et de chiffres bruts. Conçue comme un résumé visuel, elle permet de les rendre plus accessibles et ouvre aussi parfois de nouvelles perspectives.
▻http://cursus.edu/article/25159/visualisation-donnees-dessiner-pour-informer-comprendre
#visualisation
via @jcfichet

Geojournalism.org | Best tools for multimedia reporting
▻http://geojournalism.org
Geojournalism.org provides online resources and training for journalists, designers and developers to dive into the world of data visualization using geographic data.
OnionView
▻https://onionview.com
OnionView is a simple web service which uses Tor relay data, gathered using the Onionoo network status protocol, to plot the location of active Tor nodes onto an interactive map of the world.
#Datavisualisation #Représentation_graphique_de_données_statistiques #The_Onion_Router #Tor
#Fukushima : voyage au pays des #radiations
Les radiations sont des meurtriers silencieux, inodores et invisibles. L’artiste hongkongais Chris Cheung, alias #Honhim, veut les rendre palpables. Ce designer et artiste multimédia a collecté des images venues de Google Streetview et des relevés de #radioactivité pour créer une #datavisualisation #vidéo. Dans Radiance Scape, il nous emmène sur la route qui mène à Fukushima Daiichi, la centrale japonaise dont le cœur a fondu le 11 mars 2011, contaminant toute la région alentour.
Le paysage fantomatique irradie une lumière blanche, qui se teinte de rouge au fur et à mesure que les radiations s’intensifient, tandis que le cliquetis d’un compteur Geiger s’accélère. Dans cette vidéo, la menace est tangible, indique le site The Creators Project. Pour faire bonne mesure, Honhim propose la même balade dans les rues bondées de Hong Kong. Un voyage bien moins angoissant.
▻http://www.courrierinternational.com/video/japon-fukushima-voyage-au-pays-des-radiations
#art #nucléaire #invisible #visible

De la datavisualisation dessinée à la main - Rue89 - L’Obs
►http://rue89.nouvelobs.com/2015/03/30/datavisualisation-dessinee-a-main-258433
Giogia Lupi et Stefanie Posavec [...] – qui aiment bien dessiner – ont décidé de s’envoyer une carte postale avec une datavisualisation chaque semaine [PDF de présentation] :
« Dear Data est une tentative pour montrer que les “data” ne doivent pas faire peur, ne sont pas forcement “big”, mais qu’elles sont présentes dans la vie de tous et qu’il n’est pas nécessaire de connaître grand-chose pour les représenter (seulement un crayon, un carnet et une carte postale !). »
Et aussi #quantified_self, mais #à_la_main ;-)

j’ai voulu ajouter @simplicissimus à mon post, et j’avais raison de penser que ce n’était pas nécessaire ;)


Ce message est plus pour voir si j’arrive à mettre une image dans un post...
Ah ben oui ! ça marche et c’est très bien ce blog ! Merci de l’avoir signalé, je vais suivre ça de près, c’est vraiment intéressant.
Pour en savoir un peu plus sur l’auteur du blog, Franck Ghitalla, lire son portrait #autopromo, ►http://www.lemonde.fr/sciences/article/2012/12/27/franck-ghitalla-l-as-des-reseaux_1810967_1650684.html

La dataviz facile : 5 manières d’aborder la #datavisualisation | Data Publica
▻http://www.data-publica.com/content/2014/03/la-dataviz-facile-5-manieres-daborder-la-datavisualisation/#
De façon ludique et pratique, Data Publica a sélectionné 5 manières d’aborder la datavisualisation : avec un outil puissant et pratique, Datawrapper, une bibliothèque outillée, Data Publica, une personnalité, Karen Bastien, un blog de veille, “The Datavisualisation Catalogue” et enfin un très bon cours d’histoire réalisé par Gaëtan Gaborit.